
The Markets (as of market close May 17, 2024)
Both the S&P 500 and the Nasdaq advanced for the fourth straight week, which is the first time that has happened since February. Not to be outdone, the Dow advanced for a fifth straight week. Much of the week's focus was on inflation data (see below). Investors will now look to responsive comments from Federal Reserve officials for any potential changes in interest rate expectations. Information technology and real estate led the market sectors, while consumer discretionary and industrials closed in the red. The dollar slipped nearly 0.75% against a basket of currencies. Gold prices advanced over 2.0% for the week and nearly 17.0% for the year. Crude oil prices climbed more than $1.00 per barrel.
Wall Street ended last Monday with mixed results. The Dow ended its winning streak at eight days after falling 0.2%. The S&P 500 declined less than 0.1%. The Nasdaq rose 0.3%. The Global Dow gained 0.2%, while the Russell 2000 inched up 0.1%. Ten-year Treasury yields dipped to 4.48%. Crude oil prices gained $0.93 to $79.19 per barrel. The dollar (-0.1%) and gold prices (-1.3%) declined.
Last Tuesday saw stocks end higher ahead of the release of Wednesday's Consumer Price Index. The Russell 2000 led the benchmark indexes listed here, climbing 1.2%, followed by the Nasdaq (0.8%), the S&P 500 (0.5%), the Global Dow (0.4%), and the Dow (0.3%). The yield on 10-year Treasuries fell 3.6 basis points to 4.44%. Crude oil prices dipped $1.00 to $78.14 per barrel. The dollar fell 0.2%, while gold prices advanced 0.8%.
Stocks rallied last Wednesday with the Nasdaq, the Dow, and the S&P 500 closing at record highs. Investors were buoyed by a softer Consumer Price Index, which showed inflation slowed somewhat in April. The Nasdaq gained 1.4%, the S&P 500 advanced 1.2%, and the Russell 2000 climbed 1.1%. The Dow rose 0.9% and the Global Dow gained 0.8%. Ten-year Treasury yields fell 8.9 basis points to 4.35%. Crude oil prices rose to $78.84 per barrel, up $0.82. The dollar fell 0.7%, while gold prices climbed 1.4%.
After reaching record highs on Wednesday, the Nasdaq (-0.3%), the S&P 500 (-0.2%), and the Dow (-0.1%) dipped lower on Thursday. The Russell 2000 fell 0.6% and the Global Dow slipped 0.1%. Ten-year Treasury yields closed the session at 4.37% after gaining 2.1 basis points. Crude oil prices rose $0.66 to $79.29 per barrel. The dollar ticked up 0.2%, while gold prices fell 0.6%.
Stocks ended the week with mixed results. The Dow (0.3%) closed at a new record high. The S&P 500 and the Global Dow ticked up 0.1%, while the Nasdaq fell 0.1%. The Russell 2000 dipped less than 0.1%. Yields on 10-year Treasuries gained 4.3 basis points to close the day and the week at 4.42%. Crude oil prices rose $0.72, the dollar was flat, while gold prices climbed 1.4%.
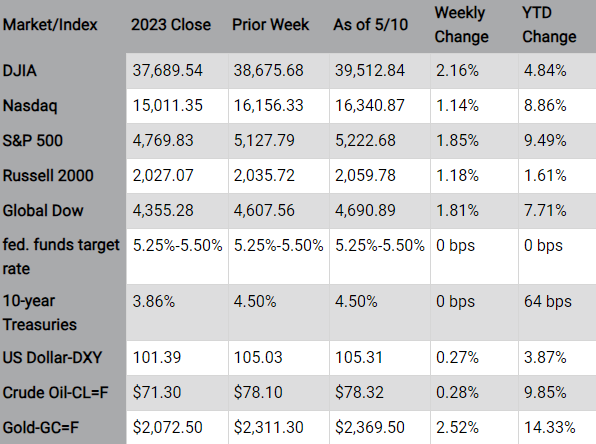
Stock Market Indexes

Chart reflects price changes, not total return. Because it does not include dividends or splits, it should not be used to benchmark performance of specific investments.
Last Week's Economic News
Consumer prices rose 0.3% in April after rising 0.4% in March. Over the last 12 months, consumer prices were up 3.4%. Excluding food and energy, consumer prices rose 0.3% for the month and 3.6% for the year. While prices may have decreased some, they remain well above the Federal Reserve's 2.0% target, which likely means no interest rate cuts are in the offing. Increases in prices for shelter (0.4%) and gasoline (2.8%) accounted for more than 70% of the overall increase in April. Prices for food were unchanged last month.
Inflationary pressures were evident at the producer level, where April's increase exceeded expectations. Prices at the producer level rose 0.5% in April, while core prices, excluding food and energy, also rose 0.5% last month. For the year, producer prices have risen 2.2%, the largest increase in a year. Nearly 75% of the April increase was attributable to a 0.6% increase in prices for services. Prices for goods moved up 0.4%.
Retail and food services sales were unchanged in April after increasing 0.6% in March. Retail sales excluding motor vehicles rose 0.2%, while sales excluding motor vehicles and gasoline were down 0.1% last month. Prices at the pump rose 3.1% in April, reflecting higher product prices plus an increase in sales volume during the spring holiday travel period. Over the last 12 months, retail sales rose 3.0%. Nonstore retailers saw sales increase 7.5% from last year, while sales at food services and drinking places were up 5.5% from April 2023.
Import prices increased 0.9% in April, after advancing 0.6% in March. The April increase in import prices was the largest one-month advance since March 2022. Over the last 12 months, import prices advanced 1.1%, the largest 12-month increase since December 2022. Prices for exports increased 0.5% in April following a 0.1% advance the previous month. Export prices have not decreased on a monthly basis since December 2023. Despite the recent increases, export prices declined 1.0% over the past year, the smallest over-the-year drop since February 2023.
Total industrial production was unchanged in April from March. Industrial production in April was 0.4% below its April 2023 level. Manufacturing output decreased 0.3%. Excluding motor vehicles and parts, manufacturing output edged down 0.1%. Mining fell 0.6%, while utilities rose 2.8%.
The number of residential building permits issued in April declined by 3.0% from the March estimate and 2.0% below the April 2023 rate. Permits for single-family home construction were 0.8% below the March figure. The number of housing starts, on the other hand, rose 5.7% in April but were 0.6% below the estimate from a year earlier. Single-family housing starts dipped 0.4% last month. Housing completions rose 8.6% in April and 14.6% above the April 2023 rate. Completions of single-family homes jumped 15.4% last month.
The national average retail price for regular gasoline was $3.608 per gallon on May 13, $0.035 per gallon below the prior week's price but $0.072 per gallon more than a year ago. Also, as of May 13, the East Coast price fell $0.058 to $3.491 per gallon; the Midwest price increased $0.038 to $3.434 per gallon; the Gulf Coast price decreased $0.076 to $3.168 per gallon; the Rocky Mountain price declined $0.062 to $3.401 per gallon; and the West Coast price decreased $0.060 to $4.694 per gallon.
For the week ended May 11, there were 222,000 new claims for unemployment insurance, a decrease of 10,000 from the previous week's level, which was revised up by 1,000. According to the Department of Labor, the advance rate for insured unemployment claims for the week ended May 4 was 1.2%, unchanged from the previous week's rate. The advance number of those receiving unemployment insurance benefits during the week ended May 4 was 1,794,000, an increase of 13,000 from the previous week's level, which was revised down by 4,000. States and territories with the highest insured unemployment rates for the week ended April 27 were in New Jersey (2.4%), California (2.3%), Massachusetts (1.8%), Rhode Island (1.8%), Illinois (1.7%), New York (1.7%), Alaska (1.6%), Nevada (1.6%), Washington (1.6%), Connecticut (1.5%), and Minnesota (1.5%). The largest increases in initial claims for unemployment insurance for the week ended May 4 were in New York (+10,171), California (+3,595), Indiana (+2,367), Illinois (+1,836), and Texas (+1,253), while the largest decreases were in Iowa (-1,177), New Hampshire (-435), Connecticut (-334), Louisiana (-213), and Kentucky (-208).
Eye on the Week Ahead
This week, the April data on sales of existing homes and new homes is released. March saw sales of existing homes decline, helping to draw sales down 3.7% over the last 12 months. New home sales advanced in March and are up over 8.0% for the year.
Advisory services offered through Capital Analysts or Lincoln Investment, Registered Investment Advisers.
Securities offered through Lincoln Investment, Broker/Dealer, Member FINRA/SIPC.
www.lincolninvestment.com
Outlook Financial Group, LLC and the above firms are independent and non-affiliated.
The Lincoln Investment Companies do not provide tax, legal, or social security claiming advice. The information presented here is not specific to any individual's personal circumstances. To the extent that this material concerns tax matters, it is not intended or written to be used, and cannot be used, by a taxpayer for the purpose of avoiding penalties that may be imposed by law. Each taxpayer should seek independent advice from a tax professional based on his or her individual circumstances. These materials are provided for general information and educational purposes based upon publicly available information from sources believed to be reliable - we cannot assure the accuracy or completeness of these materials. The information in these materials may change at any time and without notice. Diversification or asset allocation do not guarantee a profit or protect against a loss. Calculators are provided only as general self-help planning tools. Results depend on many factors, including the assumptions you provide and may vary with each use and over time. We do not guarantee their accuracy, or applicability to your circumstances.
Prepared by Broadridge Advisor Solutions Copyright 2024.
Data sources: Economic: Based on data from U.S. Bureau of Labor Statistics (unemployment, inflation); U.S. Department of Commerce (GDP, corporate profits, retail sales, housing); S&P/Case-Shiller 20-City Composite Index (home prices); Institute for Supply Management (manufacturing/services). Performance: Based on data reported in WSJ Market Data Center (indexes); U.S. Treasury (Treasury yields); U.S. Energy Information Administration/Bloomberg.com Market Data (oil spot price, WTI, Cushing, OK); www.goldprice.org (spot gold/silver); Oanda/FX Street (currency exchange rates).
News items are based on reports from multiple commonly available international news sources (i.e., wire services) and are independently verified when necessary with secondary sources such as government agencies, corporate press releases, or trade organizations. All information is based on sources deemed reliable, but no warranty or guarantee is made as to its accuracy or completeness. Neither the information nor any opinion expressed herein constitutes a solicitation for the purchase or sale of any securities, and should not be relied on as financial advice. Forecasts are based on current conditions, subject to change, and may not come to pass. U.S. Treasury securities are guaranteed by the federal government as to the timely payment of principal and interest. The principal value of Treasury securities and other bonds fluctuates with market conditions. Bonds are subject to inflation, interest-rate, and credit risks. As interest rates rise, bond prices typically fall. A bond sold or redeemed prior to maturity may be subject to loss. Past performance is no guarantee of future results. All investing involves risk, including the potential loss of principal, and there can be no guarantee that any investing strategy will be successful.
The Dow Jones Industrial Average (DJIA) is a price-weighted index composed of 30 widely traded blue-chip U.S. common stocks. The S&P 500 is a market-cap weighted index composed of the common stocks of 500 largest, publicly traded companies in leading industries of the U.S. economy. The NASDAQ Composite Index is a market-value weighted index of all common stocks listed on the NASDAQ stock exchange. The Russell 2000 is a market-cap weighted index composed of 2,000 U.S. small-cap common stocks. The Global Dow is an equally weighted index of 150 widely traded blue-chip common stocks worldwide. The U.S. Dollar Index is a geometrically weighted index of the value of the U.S. dollar relative to six foreign currencies. Market indexes listed are unmanaged and are not available for direct investment.